大きなデータの分布形状
大きなサンプルサイズのデータセットについて 分布のグラフを作成する方法。
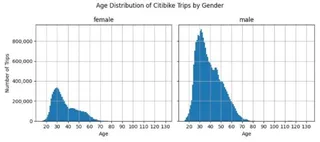
BigQueryオープンデータセットの ニューヨーク市シティバイクの利用データに対して 性別毎の利用者年齢の分布を調べます。
環境
from IPython.display import display, Markdownimport sys
print(f"{sys.version_info=}")
# > sys.version_info=sys.version_info(major=3, minor=11, micro=7, releaselevel='final', serial=0)import matplotlib as mpl
from matplotlib import pyplot as plt
from matplotlib import ticker
import numpy as np
import pandas as pd
pd.options.mode.copy_on_write = True
print(f"{mpl.__version__=}")
# > mpl.__version__='3.8.2'
print(f"{np.__version__=}")
# > np.__version__='1.26.2'
print(f"{pd.__version__=}")
# > pd.__version__='2.1.4'クエリの実行
はじめに利用回数を性別毎、各年齢単位で集計します。
WITH
raw_data AS (
  SELECT
    starttime,
    birth_year,
    gender
  FROM `bigquery-public-data.new_york_citibike.citibike_trips`
),
extract_year_from_starttime AS (
  SELECT
    starttime,
    birth_year,
    -- 利用した西暦を抽出
    EXTRACT(YEAR FROM starttime) AS year,
    gender
  FROM raw_data
),
calculation_rider_age AS (
  SELECT
    starttime,
    birth_year,
    year,
    -- 利用者の生まれた西暦から利用時の年齢を計算
    year - birth_year AS rider_age,
    gender
  FROM extract_year_from_starttime
),
count_rider_age AS (
  SELECT
    rider_age,
    gender,
    COUNT(1) AS num_rider
  FROM calculation_rider_age
  GROUP BY rider_age, gender
)

SELECT
*
FROM count_rider_age;
グラフ作成
CSVファイルにクエリ結果を出力した後、Pandasを用いて集計データを読み込みます。
# NULLは除外
df = (
    pd.read_csv("data/num_rider.csv")
    .dropna()
    )
df.head()| rider_age | gender | num_rider | |
|---|---|---|---|
| 0 | 46 | male | 512864 |
| 1 | 39 | male | 583923 |
| 2 | 38 | male | 597902 |
| 3 | 45 | male | 534975 |
| 4 | 62 | male | 147757 |
ドキュメントに従って、階段型グラフstairs()をつかって “histgram-like” なカウントデータのグラフ作成します。
(weightsにカウントデータを渡すことでhist()でもグラフの作成が可能ですが、混乱を避けるためにstairs()を使います。)
# グラフ作成の補助関数を実装します
def count_data_distribution(ax, x, y, bin_width):
    """ 階段型グラフのwrapper
    """
    heights = y
    positions = x
    # `stairs()` ではx軸のデータはy軸よりひとつ多い必要があります
    if len(positions) != (len(heights) + 1):
        positions = np.append(positions, [positions[-1] + bin_width])

    stairs = ax.stairs(heights, positions, fill=True)
    return ax, stairs

def format_yticks(ax, format_func):
    """ y軸目盛のformatter
    """
    formatter = ticker.FuncFormatter(format_func)
    ax.yaxis.set_major_formatter(formatter)
    return ax

bin_width = 1.0
genders = ['female', 'male']

fig, axes = plt.subplots(figsize=(9, 4), ncols=2, sharey=True, layout="tight")

# 性別毎にグラフを作成します
for ax, gender in zip(axes, genders):
    temp = (
          df
          .query("gender==@gender")
          .sort_values(["rider_age"], ignore_index=True)
          )
    x = temp["rider_age"].dropna().to_numpy()
    y = temp["num_rider"].dropna().to_numpy()

    count_data_distribution(ax, x, y, bin_width)
    ax.xaxis.set_major_locator(ticker.MultipleLocator(10))
    ax.set_xlabel("Age")
    ax.set_title(gender)
    ax.grid()

format_yticks(axes[0], (lambda x, _: f"{int(x):,d}"))
axes[0].set_ylabel("Number of Trips")

fig.suptitle("Age Distribution of Citibike Trips by Gender")
fig.savefig("images/distribution.jpeg");
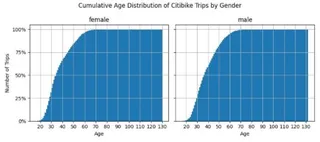
また累積分布のグラフも描画することで、 データ分布の様子を詳細に理解できます。
# 性別毎に利用回数の総合計を計算します
total_num_rider = (
    df
    .groupby(["gender"], as_index=False)
    ["num_rider"].sum()
    .rename(columns={"num_rider": "total_num_rider"})
)

# 累積割合を計算します
df = (
    pd.merge(left=df, right=total_num_rider, on="gender", how="left")
    .sort_values(["gender", "rider_age"], ignore_index=True)
    .assign(
        percentage=lambda x: 100 * x["num_rider"] / x["total_num_rider"],
        cumlative=lambda x: x.groupby("gender")["percentage"].cumsum()
    )
)

fig, axes = plt.subplots(figsize=(9, 4), ncols=2, sharey=True, layout="tight")

# 性別毎にグラフを作成します
for ax, gender in zip(axes, genders):
    temp = (
          df
          .query("gender==@gender")
          .sort_values(["rider_age"], ignore_index=True)
          )
    x = temp["rider_age"].dropna().to_numpy()
    y = temp["cumlative"].dropna().to_numpy()

    count_data_distribution(ax, x, y, bin_width)

    ax.xaxis.set_major_locator(ticker.MultipleLocator(10))

    ax.set_xlabel("Age")
    ax.set_title(gender)
    ax.grid()

axes[0].set_ylabel("Number of Trips")

axes[0].yaxis.set_major_locator(ticker.MultipleLocator(25))
format_yticks(axes[0], (lambda x, _: f"{int(x):d}%"))

fig.suptitle("Cumulative Age Distribution of Citibike Trips by Gender")
fig.savefig("images/cumulative_distribution.jpeg");